https://python.plainenglish.io/crafting-compelling-interactive-visualizations-with-python-and-folium-99a95d41219b
Web Map
Unlocking the power of data through engaging visualizations is a transformative skill. When it comes to geospatial data, interactive maps stand out as an effective means of conveying complex information. In this tutorial, we’ll delve into the creation of an interactive map using Python and the Folium library.
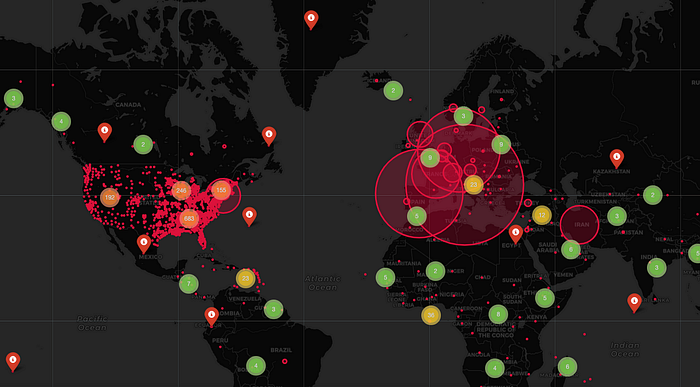
Our map will feature two layers: one showcasing volcano locations and elevations, and another revealing country population densities. This dynamic visualization allows readers to intuitively explore the spatial relationships between volcanoes and global human populations.
You can access the complete code on my GitHub repository. Take a closer look at the interactive map, gain insights, fork it for your projects, and kickstart your journey.
Let’s begin by walking through the Python implementation using Folium and Pandas. This involves reading datasets, data preparation, configuring map parameters, adding layers and markers, and ultimately saving the visualization.
We start by importing the necessary libraries:
import folium
import pandas as pd
Next, we read the raw data on volcano locations and population estimates:
data = pd.read_csv('Volcanoes.txt')
This yields a Pandas data frame containing latitude, longitude, and elevation information for over 1,500 volcanoes globally.
For country population data, we’ll use the GeoJSON file ‘world.json,’ a format well-suited for mapping libraries like Folium. We extract key columns from the volcano data frame:
lat = list(data["LAT"])
lon = list(data["LON"])
ele = list(data["ELEV"])
Now, let’s define a function to color volcano markers based on elevation:
def color_marker(elevation):
    if elevation < 1000:
        return 'red'
    elif 1000 <= elevation < 3000:
        return 'orange'
    else:
        return 'green'
With data prepared, we create the base Folium map centered on North America:
map = folium.Map(location=[38.58, -99.08], zoom_start=6, tiles='OpenStreetMap')
We add two FeatureGroup layers for volcanoes and population data: